Pipeline Risk ManagementTECHNICAL
Ricardo Rodrigues. Chemist, Executive Director do ITSEMAP Brazil
Major advances in Brazil’s energy sector, particularly oil and gas, have required a series of investments not only in production and exploration, but also in the infrastructure for transporting the products extracted from the exploitation fields to the refineries.
In this context, one would emphasise the investments made in recovering the country’s rail network as well as in building pipelines to transport oil, derivatives, gas and alcohol – an infrastructure that has been extended in recent years.
PETROBRAS TRANSPORTE (TRANSPETRO) alone currently has a network of 7,000 km of oil pipeline and 4,000 km of gas pipeline, in addition to 26 river terminals and 20 land terminals.
In the area of natural gas distribution, Brazil currently has 26 distribution companies present in almost all of the country’s states. One would highlight the presence of multinationals such as Gas Natural and the Eni Group, among others.
In addition to the oil and gas area, significant investments have been made in biodiesel and ethanol, the latter given that Brazil is a major alcohol producer and exporter.
There are many pipeline projects and works underway, generating intense demand for technical improvement in all stages of development of these installations, as well as in aspects related to environmental risk analysis.
Hence, a large number of studies and technical progress have been made not only by project developers but also by those responsible for the risk engineering chain. As a result advanced technical tools have been designed for identifying, evaluating and controlling the risks associated with pipelines used to transport hazardous products.
The analysis of risks associated to projects operating with hazardous substances has been regulated in Brazil since 1981
In Brazil, the analysis of risks associated with projects operating with hazardous substances has been regulated since 1981, both in terms of occupational health and environmental safety. In that year, Federal Law no. 6938 came into force, establishing the National Environment Policy. Subsequently, in 1986, with the publication of the Resolution 01/86 of the National Council for the Environment (CONAMA), risk analysis reports were included in the process for obtaining environmental licences.
Therefore, for more than 20 years, all new projects that affect the environment or that represent a threat to neighbouring communities, must submit a Quantitative Risk Analysis (QRA) to the competent environmental bodies in order to verify that the levels of transferred risk are tolerable in comparison to internationally accepted standards.
QRAs (Quantitative Risk Analyses)
In general, QRAs cover the following aspects:
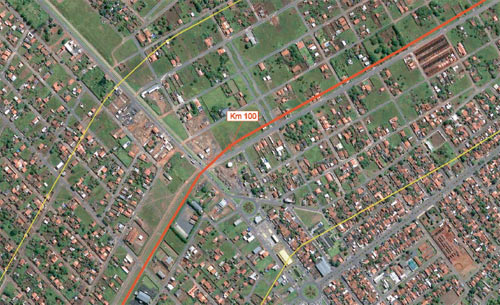
Figure 1. Example of a Pipeline Route Map (ITSEMAP Brazil)
- Regional and project description: the purpose of this first stage is to present the project/process under analysis in outline, as well as the main environmental characteristics of its location, populated areas, environmentally sensitive areas and climate and meteorological conditions. In the case of pipelines, since they are linear projects, it is important for the entire route to be mapped and for all vulnerable elements to be identified that could be affected by an accident, whether by a spill into bodies of water, fires or explosions or toxic gas emissions into the atmosphere. Figure 1 is an example of a pipeline map for the purposes of a QRA, prepared by ITSEMAP Brazil.
- Characteristics and properties of the substances: all of the hazardous substances
involved in the process under evaluation
must be described. From a general point
of view, the main information to submit is:
- Physical and chemical composition and properties;
- Hazardous nature;
- Fire hazards, fire protection and fire fighting methods;
- Toxicological parameters;
- First aid;
- Actions to be taken in an emergency.
- Accident History Analysis (AHA): the main
purpose of this is to report the frequencies
of defined accidents, the types of scenarios
and likely damage, as well as its causes.
To do this, accident data banks and international
references are consulted such as:
- UKOPA (United Kingdom Onshore Pipeline Operator’s Association, UK);
- DOT/OPS (Department of Transportation, Office of Pipeline Safety, USA),
- CONCAWE (Conservation Of Clean Air, Water and the Environment, BE);
- PARLOC (Pipelines and Risers, Loss of Containment, UK);
- MHIDAS (Major Hazardous Incident Data Service, UKAEA);
- EGIG (European Gas Incident Data Group).
- Identification of scenarios: the purpose of this stage is to identify the various typical hypotheses for accidents in the operating phase of the project under study. In the case of pipelines, they are normally associated to lost contention capacity due to major cracks or the appearance of holes in the pipes. In order to typify the causes various methodologies are usually applied, such as: HazOp, FME or, Checklist’s, among others. At the same time, for pipeline studies the use of a Preliminary Hazard Analysis is fairly common (PHA).
- Estimation of frequencies: the annual frequencies with which each of the accident scenarios identified in the previous stage occur must be estimated, taking as reference the historical records analysed in the AHA carried out previously. The preparation of Event Trees, as shown in Figure 2, illustrates the different accident scenarios (evolutions) that can arise from the accident hypotheses, and calculates the frequency with which they are likely to occur.
- Calculation of consequences and vulnerability
analysis: the different consequences (physical effects) associated to the accident
scenarios under study are calculated using
suitable simulation models that represent
studied phenomena, such as fires, explosions
and the emission of toxic substances.
These effects are appraised in terms of the
vulnerability of the affected areas by means
of PROBIT - type equations (Probabilistic Unit
Method). In general, the considered ranges
of physical effects, for both risk evaluation
and support in developing future emergency
response plans, are:
- Heat radiation: Probits corresponding to 1%, 50% and 99% probability of occurring and corresponding effects at 3.0 kW/m2.
- Vapour Cloud Fire (Flashfire): Lower Flammability Limit (LFL).
- Overpressure: Probits corresponding to 1%, 50% and 99% probability of occurring and corresponding effects at 0.05 bar.
In the case of pipelines used to transport liquids it is necessary to calculate spilled volumes prior to carrying out the physical effect simulations. Depending on the course and extension of the pipeline under study, this calculation can be very complex, also taking into account operational aspects (pump stop times and intermediate and final valve closing).
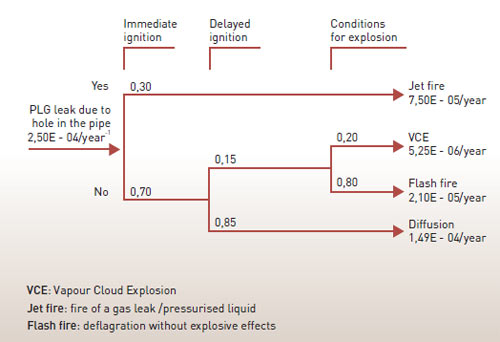
Figure 2. Example of a Gas Pipeline Event Tree
All new projects that affect the environment or that represent a threat to neighbouring communities, must submit a Quantitative Risk Analysis (QRA)
LeakMAP
In order to cover this need, ITSEMAP has developed a specific computer application to carry out these calculations, known as LeakMAP.
In general terms, the LeakMAP Programme determines the total spilled volume from a pipeline taking into consideration the sum of the volume spilled until detection of the leak and that occurring during the emptying of the hydraulic column. Thus, these calculations take the following parameters, among others, into account:
- Fuel discharge coefficient.
- Pipe burial depth.
- Nominal diameter and thickness of the pipe wall.
- Pressure gauge heights at product inlet and outlet.
- Density and pressure of the vapour of the transported product.
- Hydraulic profile of the pipe.
- Diameter of the leak hole.
- Maximum time estimated for containing the spill.
- Estimated time for detecting the spill.
- Time to cease pumping.
- Time needed to block the valves in order to isolate the leak point.
As a result, the programme supplies the initial discharge rate, initial discharge speed, spill duration and total spill volume.
The LeakMAP Programme determines the total volume leaked from a pipeline taking into consideration the sum of the volume spilled in the time until the leak was detected and that occurring during emptying of the hydraulic column
- Risk estimation and evaluation: the combination
of frequencies of occurrence with
the studied physical effects provides a
quantification of the risks, which must be
expressed as Individual Risk (IR) and Social
Risk (SR), the latter represented in the form
of a curve F-N (accumulated frequency x
number of potential fatalities).
In order to carry out these complex calculations, ITSEMAP has developed the QuantoX tools with a specific complement to analyse linear risks, such as pipeline routes.
The estimated risk levels must be compared with the tolerance criteria established by the Environmental Bodies that authorise and tax the projects, whose IR criteria (individual risk of fatality per year) are presented in Figure 3.
Another important aspect is that for the installation of additional pipelines on existing routes where other pipes used to transport hazardous substances already operate, the total risk of the affected stretch of land must be estimated. If the level of accumulated risk is higher than admissible, an additional stretch of land will be determined for production where construction of any type will be prohibited, so as to guarantee the safety of the people in the vicinity of the pipeline as shown in Figure 4. - Mitigating measures and risk management: need to be defined and established in the event
of the risks of the pipeline under study exceeding
the tolerance level according to the criteria
established in the corresponding legal
norms. Their objective is to reduce the risks
and guarantee the necessary level of safety.
Finally, it is worth noting that before a new
pipeline starts functioning, the operator must
have established a Risk Management Programme
(RMP) as a means to guarantee the
safe start-up of the project with all risks
fully under control. In general, the scope of
a RMP extends to:
- Safety information.
- Risk analysis and review policy.
- Management of modifications.
- Maintenance and guarantee of critical systems’ integrity.
- Operating norms and procedures.
- HR training policy for personnel involved in the pipeline’s operation.
- Procedures for investigating incidents.
- Audit programme.
- Emergency plan.
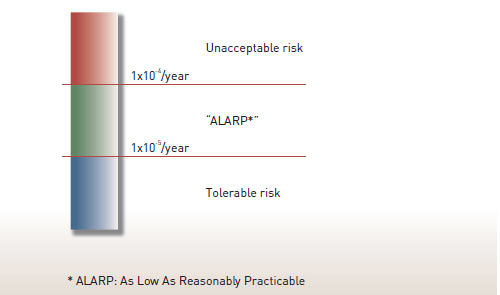
Figure 3. Tolerance Criteria of Individual Risk for Pipelines (CETESB, 2003)
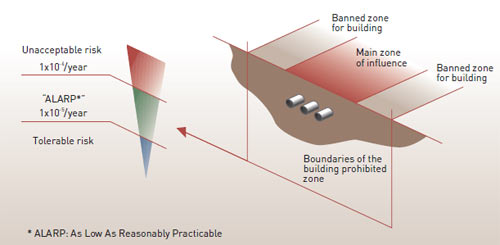
Figure 4. Individual Risk Criteria for the Non-Buildable Plot (IBAMA, 2005)
Before a new pipeline starts functioning, the operator must have established a Risk Management Programme (RMP)
Conclusion
Pipeline transport of hazardous substances, though noticeably reducing the risk in relation to other ways of transport presents residual risks with a high potential impact on human activity and the environment.
With a view to controlling that risk, the competent authorities for approving and supervising the operation as well as the operators themselves have policies and criteria for determining acceptable risk levels as well as the necessary technical and management procedures.
The complexity of risk evaluation methodologies make the use of specific tools necessary, many of which ITSEMAP has developed in order to satisfy its customers’ needs.