
Foro AGERS sobre prevención y colaboración frente al riesgo de inundación
Este 9 de abril se ha celebrado el Foro “Adaptación al riesgo de inundación: prevención y colaboración público-privada” de AGERS y Bosco Francoy, CEO de MAPFRE Global Risks, ha participado para hacer balance de la evolución de este tipo de siniestros y su impacto en...


Travesía hacia un futuro sostenible: las cadenas de suministro
La transición energética está cambiando los paradigmas de las cadenas de suministro de todo el mundo. Desde la reestructuración de modelos energéticos hasta reajustes en las estrategias logísticas, esta evolución plantea grandes desafíos y oportunidades para el...

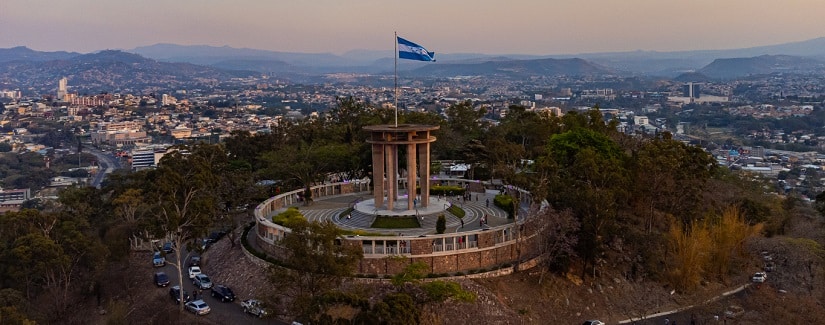
Honduras: perspectivas económicas y comerciales
Honduras se encuentra inmersa en un plan de acción para promover un crecimiento económico sostenible que impacte positivamente en sus compromisos con la ciudadanía, la mejora de infraestructuras estratégicas y el aumento de resiliencia al cambio climático. El...

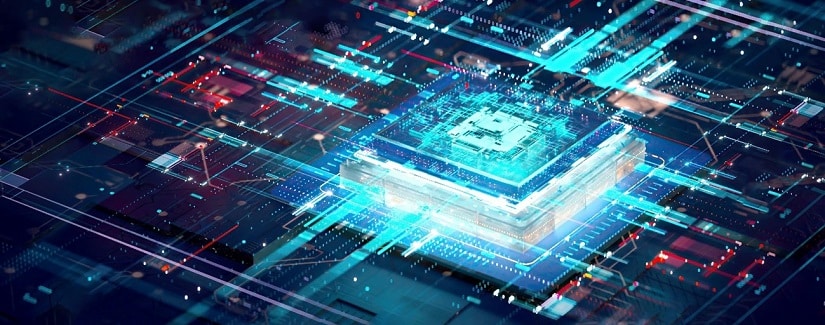
Semiconductores: el cauce de la transformación digital
Su nombre común esconde componentes esenciales para el desarrollo de las tecnologías que están cambiando el rumbo de la historia. Mientras las potencias mundiales pugnan por llevar la industria a su territorio, Panamá posee la infraestructura para hacerse referente en...

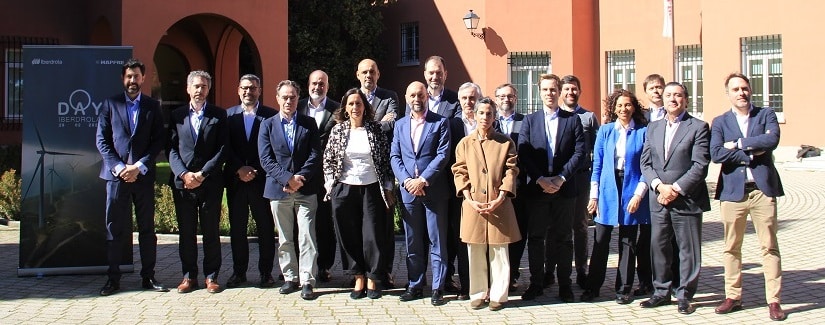
Iberdrola Day, sinergias con un cliente estratégico
El pasado 29 de febrero recibimos en la Universidad Corporativa MAPFRE, Campus Monte del Pilar, a responsables corporativos de Iberdrola con quienes compartimos su proceso de transformación, poniendo el foco en la actual transición energética y los compromisos...

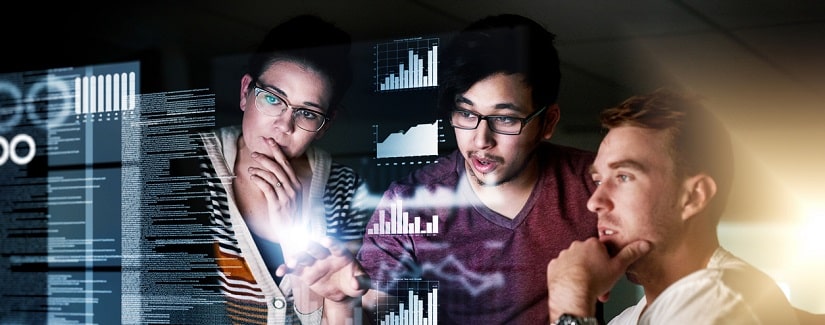
Las tecnologías que marcarán el futuro
La evolución tecnológica avanza de una manera vertiginosa y transversal, transformando desde nuestras pequeñas rutinas hasta el más trascendental negocio global. Imposibles de compactar en una pequeña lista, te damos a conocer algunas de las tecnologías más relevantes...